
Debugging
Step-by-step debugging
Learning Objectives
- Understand how to run a script under debugger control
- Understand how to use the debugger to stop execution at certain points
- Understand how to use the debugger to step through a program
The following assumes that we have the files histograms.py and do_equalization.py in our current directory, together with the example image Unequalized_Hawkes_Bay_NZ.png. The file histograms.py defines two functions a function plot_histogram and a function equalize. The function plot_histogram plots the histogram of data values in an array and the cumulative distribution of this histogram on top of it. The equalize function is meant to perform the algorithm of histogram equalization on a grayscale image:
def equalize(image, n_bins=256):
    """
    Perform histogram equalization on the given grayscale ``image`` (2D array
    of intensity values between 0 and 1), using ``n_bins`` bins for the
    histogram.
    Returns the equalized image.
    """
    bins = numpy.linspace(0, 1, n_bins, endpoint=True)
    bins, hist = numpy.histogram(image.flatten(), bins=bins, density=True)
    cdf = hist.cumsum() / n_bins
    # Invert the CDF by using numpy's interp function
    equalized = numpy.interp(image.flatten(), bins, cdf)

    # All this was performed on flattened versions of the image, reshape the
    # equalized image back to the original shape
    return equalized.reshape(image.shape)
The main idea behind the algorithm is that we want to transform the image using a mapping that preserves the relative values of the intensities but use all the values in the intensity range for an (approximately) equal amount of pixels. It turns out that inverting the cumulative distribution function of the intensity values gives us such a mapping.
With that in mind, the algorithm has the following steps:
- Calculate the histogram of the grayscale values (between 0 and 1)
- Calculate the cumulative distribution of these values
- Interpret the cumulative distribution as a function and invert it, then use that inverted function to get the new intensity values.
As a result, the equalized image should have a flat histogram of intensity values and equivalently a linear cumulative distribution of intensity values from 0 to 1.
Let’s try to run the do_equalization.py script which plots an example image and its histogram, equalizes it using the above function and plots the result:
% run do_equalization.py---------------------------------------------------------------------------
ValueError Traceback (most recent call last)
[..]/do_equalization.py in <module>()
16
17 # Equalize the image histogram
---> 18 equalized = histograms.equalize(image)
19 plt.subplot(2, 2, 3)
20 plt.imshow(equalized, cmap='gray')
[..]/histograms.py in equalize(image, n_bins)
16 cdf = hist.cumsum() / n_bins
17 # Invert the CDF by using numpy's interp function
---> 18 equalized = numpy.interp(image.flatten(), bins, cdf)
19
20 # All this was performed on flattened versions of the image, reshape the
[..]/function_base.py in interp(x, xp, fp, left, right, period)
1269 return compiled_interp([x], xp, fp, left, right).item()
1270 else:
-> 1271 return compiled_interp(x, xp, fp, left, right)
1272 else:
1273 if period == 0:
ValueError: fp and xp are not of the same length.OK, apparently that did not work. The arguments to numpy.interp do not seem to have the same length. Let’s use the debugger to investigate this:
% debug
ipdb> xp.shape
(99,)
ipdb> fp.shape
(100,)
ipdb> u
> [...]/histograms.py(18)equalize()
     16     cdf = hist.cumsum() / n_bins
     17     # Invert the CDF by using numpy's interp function
---> 18     equalized = numpy.interp(image.flatten(), bins, cdf)
     19
     20     # All this was performed on flattened versions of the image, reshape the

ipdb> bins.shape
(99,)
ipdb> cdf.shape
(100,)
ipdb> q
So it seems that bins and cdf that we provide to numpy.interp differ in their length by one. This is a typical thing to happen when dealing with histograms, since we sometimes use bins (N values) and sometimes bin edges (N+1 values). Let’s fix this, by removing the last value of the cdf variable:
def equalize(image, n_bins=256):
    bins = numpy.linspace(0, 1, n_bins, endpoint=True)
    bins, hist = numpy.histogram(image.flatten(), bins=bins, density=True)
    cdf = hist.cumsum() / n_bins
    # Invert the CDF by using numpy's interp function
    equalized = numpy.interp(image.flatten(), bins, cdf[:-1])

    # All this was performed on flattened versions of the image, reshape the
    # equalized image back to the original shape
return equalized.reshape(image.shape)Let’s run the script again:
% run do_equalization.py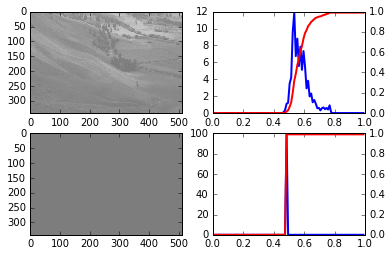
do_equalization output 1
Um, well, the script now runs without an error message but the result does not look any good. We don’t have an error that we can debug in a post-mortem way so instead we start the complete script under debugger control:
% run -d do_equalization.pyBreakpoint 1 at [...]/examples/do_equalization.py:1
NOTE: Enter 'c' at the ipdb> prompt to continue execution.
> [...]/do_equalization.py(1)<module>()
1---> 1 import matplotlib.pyplot as plt
2
3 import histograms
4
5 if __name__ == '__main__':
ipdb>As when using %debug, we now have a debugger prompt but now we are at the start of the script. The most important commands are the following:
n(next): Execute the current line and step over it (i.e. stay on the same level)s(step): Execute the current line by stepping into functions called on the linec(continue): continue execution until the end of a script, an uncaught exception or a breakpoint (see below)b(breakpoint): create a new breakpoint at a given line number (and optionally in a given file)
Just pressing return at the prompt will execute the previous command again (useful for n, s, c).
We are interested in the code happening in the equalize function, so we’ll set a breakpoint at its first line and continue our execution until then:
ipdb> b histograms.py:20
Breakpoint 2 at [...]/histograms.py:20
ipdb> c
> [...]/histograms.py(20)equalize()
     18     Returns the equalized image.
     19     """
2--> 20     bins = numpy.linspace(0, 1, n_bins, endpoint=True)
     21     bins, hist = numpy.histogram(image.flatten(), bins=bins, density=True)
     22     cdf = hist.cumsum() / n_bins

ipdb> n
> [...]/histograms.py(21)equalize()
     19     """
2    20     bins = numpy.linspace(0, 1, n_bins, endpoint=True)
---> 21     bins, hist = numpy.histogram(image.flatten(), bins=bins, density=True)
     22     cdf = hist.cumsum() / n_bins
     23     # Invert the CDF by using numpy's interp function

ipdb> bins[:10]
array([ 0.        ,  0.01010101,  0.02020202,  0.03030303,  0.04040404,
        0.05050505,  0.06060606,  0.07070707,  0.08080808,  0.09090909])
ipdb> n
> [...]/histograms.py(22)equalize()
2    20     bins = numpy.linspace(0, 1, n_bins)
     21     bins, hist = numpy.histogram(image.flatten(), bins=bins, density=True)
---> 22     cdf = hist.cumsum() / n_bins
     23     # Invert the CDF by using numpy's interp function
     24     equalized = numpy.interp(image.flatten(), bins, cdf[:-1])

ipdb> hist[:10]
array([ 0.        ,  0.01010101,  0.02020202,  0.03030303,  0.04040404,
        0.05050505,  0.06060606,  0.07070707,  0.08080808,  0.09090909])
ipdb> bins[:10]
array([ 0.,  0.,  0.,  0.,  0.,  0.,  0.,  0.,  0.,  0.])
We have found the issue: we swapped the arguments for the return value of numpy.histogram, storing the bin edges in the hist variable and the histogram in bin. Looking back at our previous fix for the inconsistent length of bin and cdf we could have realized back then that bins should have 1 element more than cdf and not the other way round… Fixing those issues leads to the following code:
def equalize(image, n_bins=256):
    bins = numpy.linspace(0, 1, n_bins, endpoint=True)
    hist, bins = numpy.histogram(image.flatten(), bins=bins, density=True)
    cdf = hist.cumsum() / n_bins
    # Invert the CDF by using numpy's interp function
    equalized = numpy.interp(image.flatten(), bins[:-1], cdf)

    # All this was performed on flattened versions of the image, reshape the
    # equalized image back to the original shape
    return equalized.reshape(image.shape)
Now our script runs and gives the expected result:
% run do_equalization.py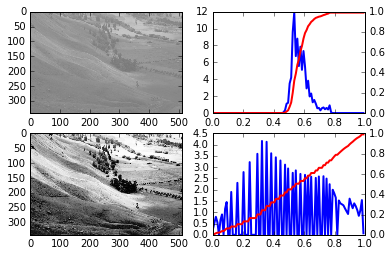
do_equalization output 2
Debug step by step
Call the check_data function from the previous section with numpy.nan as its target argument. The result is not as expected, use the debugger to go through the code step by step and find the problem.