
Advanced NumPy
Case study: K-means
Learning objectives
After the lesson the learner should:
- Be able to combine axis-based reductions, broadcasting and indexing to implement a simple clustering algorithm.
- Understand what are the advantages of vectorisation and when to use or not use it.
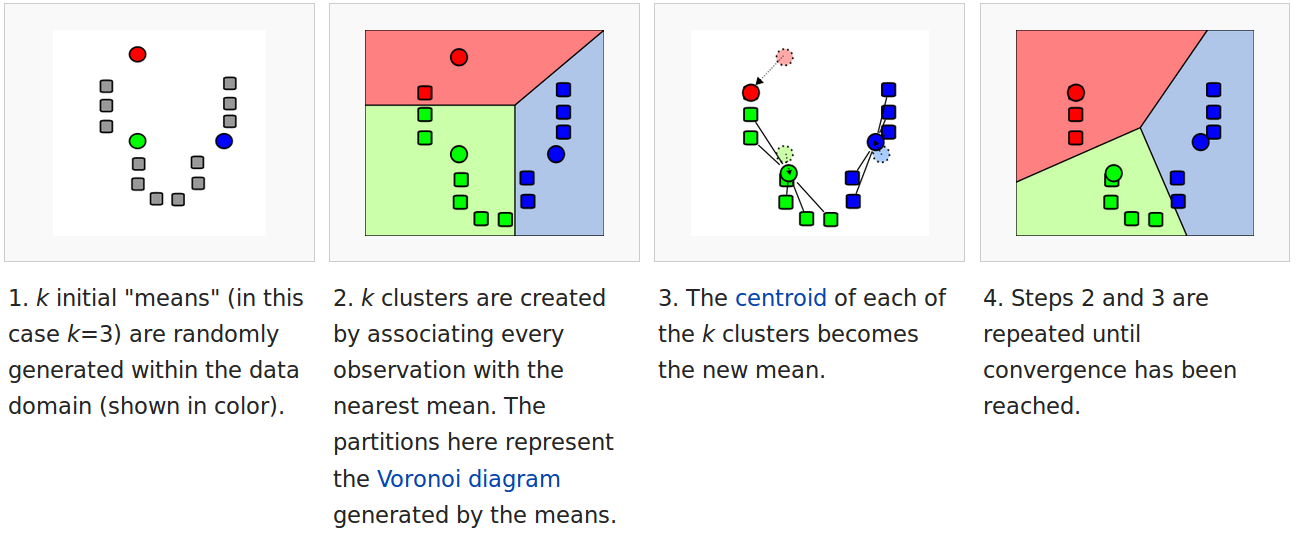
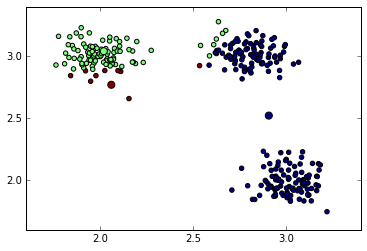
K-means is a simple algorithm to cluster data – that is to identify groups of similar objects based only on their properties. The algorithm is best-illustrated by the following graph.
Loading data
We first need to load sample. If you haven’t done some before you can download it from here.
>>> data = np.loadtxt('kmeans_data.csv')
>>> data.shape
(30, 2)
To visualise the data we can use the scatter function from matplotlib package:
>>> import matplotlib.pyplot as plt
>>> plt.scatter(data[:, 0], data[:, 1], s=40)
>>> plt.show()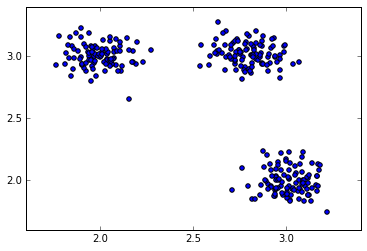
Sample data with 3 clusters
Since, we are going to build up the example gradually. Let us put the commands in a script:
import numpy as np
import matplotlib.pyplot as plt

# load data
data = np.loadtxt('kmeans_data.csv')

# plot
plt.scatter(data[:, 0], data[:, 1], s=40)
Initialisation
In the first step of the algorithm we need to initialise the centers of the clusters. We will initialise them randomly but consistently with the mean and standard deviation of the data:
K = 3
centroids = np.random.randn(K, 2)
To center the cluster centroids on the data it’s better to normalise to the mean and standard deviation of the data:
centroids = centroids * np.std(data, 0)
centroids = centroids + np.mean(data, 0)
Let’s now plot the data and the random cluster centers on the same figure:
plt.scatter(data[:, 0], data[:, 1], s=40)
plt.scatter(centroids[:, 0], centroids[:, 1], c=np.arange(3), s=100)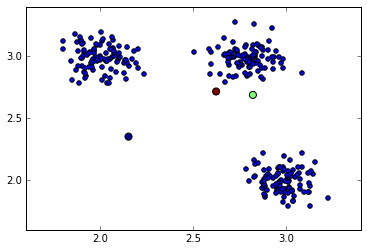
Randomly initalised cluster centers (color big dots)
Now you can copy-and-paste these lines into the script. You may find the %history command of ipython console useful.
Assignment
Find closest centers
Calculate the Euclidean distance between all data points to each of the center and then find the index of the closest center.
We now need to assign each point to the closest cluster center. First, we will calculate the Euclidean distance of each point to each of the centers. For this we can use the broadcasting:
deltas = data[:, np.newaxis, :] - centroids
distances = np.sqrt(np.sum((deltas) ** 2, 2))
For each data point we find the center with minimum distance. We can use the argmin method with the axis argument:
closest = distances.argmin(1)Now we plot the centroids and data points with the color-code reflecting cluster membership:
plt.scatter(data[:, 0], data[:, 1], s=40, c=closest)
plt.scatter(centroids[:, 0], centroids[:, 1], c=np.arange(3), s=100)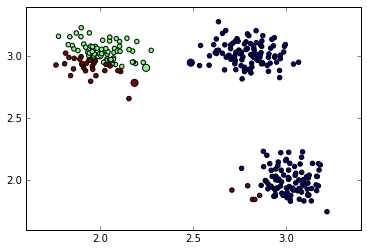
Data points assigned to closest cluster center
Calculate new cluster centers
Cluster center
Given the array of cluster assignments closest calculate the center coordinates of the first cluster cluster (index 0).
To calculate new centers of the clusters, we average all points belonging to that cluster. We can use a boolean mask. For example, to calculate the center of a cluster 0 we will use the following instruction:
data[closest==0, :].mean(0)array([ 2.90695091, 2.52099101])To repeat it for all clusters we can use a for loop or list comprehension. Since the number of clusters is usually much smaller than the number of data points, this for loop won’t affect the performance of our algorithm:
centroids = np.array([data[closest == i, :].mean(0) for i in range(3)])Lets check the positions of new centers and assignment of points to clusters.
Re-calculated cluster centers
Iterations
Now we can repeat the steps of assigning point to clusters and updating the cluster centers iteratively and watch the progress of the algorithm:
for iteration in range(5):
   # assign points to clusters
   deltas = data[:, np.newaxis, :] - centroids
   distances = np.sqrt(np.sum((deltas) ** 2, 2))
   closest = distances.argmin(1)

   # calculate new centroids
   centroids = np.array([data[closest == i, :].mean(0) for i in range(3)])
Stopping criterion
After each iteration test whether any point changes their cluster membership. Stop the algorithm if convergence was reached i.e. clusters do not change after the re-assignment step.
Putting it all together
Our final script will look as the following:
import numpy as np
import matplotlib.pyplot as plt

data = np.loadtxt('kmeans_data.csv')

# randomly initalize the centroids
K = 3
centroids = np.random.randn(K, 2)
centroids = centroids * np.std(data, 0)
centroids = centroids + np.mean(data, 0)

for iteration in range(5):
   # assign points to clusters
   deltas = data[:, np.newaxis, :] - centroids
   distances = np.sqrt(np.sum((deltas) ** 2, 2))
   closest = distances.argmin(1)

   # calculate new centroids
   centroids = np.array([data[closest == i, :].mean(0) for i in range(3)])

# plot
plt.scatter(data[:, 0], data[:, 1], s=40, c=closest)
plt.scatter(centroids[:, 0], centroids[:, 1], c=np.arange(3), s=100)

plt.show()
Choice of K
Check whether the algorithm works for any K. Try using K > 3. What happens then?
Memory or speed
Replace the assignment and calculation of new clusters with a for loop. Which implementation would be preferable for small (few observations and dimensions) and which for large datasets (large number of observations and dimensions).